Wednesday, August 7, 2013

Creating a MySQL db on Ubuntu as a normal user

Lately I tried to create a MySQL db on Ubuntu (version 11 which has MySQL 5.1 preinstalled). I was logged in under my normal username but I got a surprise when running the mysql_install_db command.
$ /usr/bin/mysql_install_db --datadir=./mysql/data
Installing MySQL system tables...

130806 22:17:21 [Warning] Can't create test file /home/andreash/mysql/data/andreas-Ub-2.lower-test

Installation of system tables failed!  Examine the logs in
./mysql/data for more information.
...

There were not log files though and checking directories and permissions didn't reveal any problems.
So I started to search and found that Ubuntu uses a security mechanism called apparmor which can be used to control certain aspects of an application.
In regards to MySQL that means that there exists a MySQL profile which defines which directories can be accessed (and how) by the MySQL programs. The profile for the daemon mysqld is defined in /etc/apparmor.d/usr.sbin.mysqld and looks like this:

# Last Modified: Tue Jun 19 17:37:30 2007
#include <tunables/global>

/usr/sbin/mysqld {
  #include <abstractions/base>
  #include <abstractions/nameservice>
  #include <abstractions/user-tmp>
  #include <abstractions/mysql>
  #include <abstractions/winbind>

  capability dac_override,
  capability sys_resource,
  capability setgid,
  capability setuid,

  network tcp,

  /etc/hosts.allow r,
  /etc/hosts.deny r,

  /etc/mysql/*.pem r,
  /etc/mysql/conf.d/ r,
  /etc/mysql/conf.d/* r,
  /etc/mysql/*.cnf r,
  /usr/lib/mysql/plugin/ r,
  /usr/lib/mysql/plugin/*.so* mr,
  /usr/sbin/mysqld mr,
  /usr/share/mysql/** r,
  /var/log/mysql.log rw,
  /var/log/mysql.err rw,
  /var/lib/mysql/ r,
  /var/lib/mysql/** rwk,
  /var/log/mysql/ r,
  /var/log/mysql/* rw,
  /{,var/}run/mysqld/mysqld.pid w,
  /{,var/}run/mysqld/mysqld.sock w,

  /sys/devices/system/cpu/ r,

  # Site-specific additions and overrides. See local/README for details.
  #include <local/usr.sbin.mysqld>
}

So in order to enable MySQL to access a subdirectory of my $HOME I had to edit the file as root (sudo vi ...) and add this line to the list (I put it right under the /sys/devices line)

  /home/andreas/mysql/** rw,

The apparmor man page explains the syntax and attributes in detail. For my purposes it suffices to know that ** stands for the directory and all subdirectories underneath and rw is of course read/write.

Then this new profile needs to be activated replacing the old one via

$ sudo apparmor_parser -rv /etc/apparmor.d/usr.sbin.mysqld
Replacement succeeded for "/usr/sbin/mysqld".

Finally running the MySQL program again did create the databases.

Installing MySQL system tables...
OK
Filling help tables...
OK

To start mysqld at boot time you have to copy
support-files/mysql.server to the right place for your system

PLEASE REMEMBER TO SET A PASSWORD FOR THE MySQL root USER !
To do so, start the server, then issue the following commands:

...

Not knowing much about apparmor yet I wonder how one would go about to allow all users (on a bigger multi-user server) to use MySQL or any other application which is secured in the same way. It would be impractical to add all users home directories to the profile file so I guess there must be some shortcut. This needs more reading.

Friday, August 2, 2013

LibreOffice calc: automatically sort data upon data entry

A common task in LibreOffice (or Apache OpenOffice) calc is to sort a range of cells via Data -> Sort... where the sort criteria (columns, sort order) are defined.
If the spreadsheet is a living document where entries are deleted and new entries entered on a regular basis one would wish for this sorting to be done automatically rather than the user having to do it manually each time. In this article I show how to achieve this with macros in LibreOffice.

The very basic idea of automation is to assign a macro to an event. In case that event happens the macro is being run.

But before I get to that I'd like to outline the steps and how they are connected.

  • First define a range for the cells to be sorted
  • Then create the macro which will be triggered (it will make use of the range)
  • Assign the macro to the 'change content' event Now whenever the content of a cell is changed the macro will be triggered and run.

    Define a range

    Assume the data to be sorted are in two columns A and B. Currently I have only 4 entries but there could be more in the future. The columns also have a header in the first row.
    The range is set by
  • marking columns A and B
  • going to Data -> Define Range... and entering a name for the selection and finally clicking Add and OK. I chose the name 'MyData'.

    Create a macro

    It would suffice to create one macro but I opted to split the macro into two, one being of a more general reusable nature and the other more specific to the event.

    The first macro 'SortRange' sorts a range by its second column in descending order using the first row as header i.e. not part of the actual sort. The macro gets a range object as parameter and thus could be used for any range.

    Sub SortRange( oRange As Variant )     
    rem Sorts range 'sRange' by column 2 in descending order
    rem (assumes that columns have labels in first row)
    
    rem ----------------------------------------------------------------------
    rem define variables
    dim document   as object
    dim dispatcher as object
    rem ----------------------------------------------------------------------
    rem get access to the document
    document   = ThisComponent.CurrentController.Frame
    dispatcher = createUnoService("com.sun.star.frame.DispatchHelper")
    
    rem ----------------------------------------------------------------------
    rem Select the range
    dim args1(0) as new com.sun.star.beans.PropertyValue
    args1(0).Name = "ToPoint"
    args1(0).Value = oRange.AbsoluteName
    
    dispatcher.executeDispatch(document, ".uno:GoToCell", "", 0, args1())
    
    rem ----------------------------------------------------------------------
    dim args2(7) as new com.sun.star.beans.PropertyValue
    args2(0).Name = "ByRows"
    args2(0).Value = true
    args2(1).Name = "HasHeader"
    args2(1).Value = true
    args2(2).Name = "CaseSensitive"
    args2(2).Value = false
    args2(3).Name = "NaturalSort"
    args2(3).Value = false
    args2(4).Name = "IncludeAttribs"
    args2(4).Value = true
    args2(5).Name = "UserDefIndex"
    args2(5).Value = 0
    
    Rem Sort by the second column of the range !!!
    args2(6).Name = "Col1"
    args2(6).Value = oRange.RangeAddress.StartColumn + 2
    
    args2(7).Name = "Ascending1"
    args2(7).Value = false
    
    dispatcher.executeDispatch(document, ".uno:DataSort", "", 0, args2())
    
    End Sub
    
    Note how the Data -> Sort... Options are mapped to these properties and could be adjusted if one wanted different sorting criteria.

    The second macro 'SortRangeFilter' checks whether the change actually happened inside the range and then calls the SortRange macro. The name of the range is hardcoded in this macro and thus makes it inflexible but I couldn't find a better way (yet).
    Macros which are triggered by an event listener get passed a parameter which describes the source object. These can be different things which I need to differentiate in my code:

  • a single cell e.g. when entering a value
  • a range of cells e.g. when deleting a row
  • a set of ranges e.g. when marking and deleting two disjunct cells
    In the last cases my selection might contain cells which are not members of my defined range. In order to make my code the most flexible I apply the following logic:
  • a single cell is just a special case of range of cells thus I only need to differentiate two cases
  • for the remaining cases I determine the intersection of my named range with the selection (= source of the event). If it is empty there is nothing to do, otherwise I need to sort the range.

    Sub SortRangeFilter( oEvent As Variant )
    
    Dim sRange As String
    sRange = "MyData"
    Rem       ^^^^^^
    Rem       Hardcoded range name
    
    Rem Get the range object in order to access its boundaries
    Dim oSheet As Variant
    oSheet = ThisComponent.CurrentController.getActiveSheet()
    
    Rem Define an error handler in case the range name does not exist
    On Error Goto ErrorHandler
    Dim oCellRange As Variant
    oCellRange = oSheet.getCellRangeByName( sRange )
    
    Rem Check the type of 'oEvent'
    Rem Both support the 'queryIntersection' method
    If ( oEvent.supportsService( "com.sun.star.sheet.SheetCellRanges" ) Or _
         oEvent.supportsService( "com.sun.star.sheet.SheetCellRange" )) Then
      If oEvent.queryIntersection( oCellRange.RangeAddress ).count > 0 Then
        SortRange( oCellRange )
      Endif
    Endif
    Exit Sub
    
    ErrorHandler:
      Msgbox "SortRangeFilter: Range does not exist '" + sRange + "'"
      Exit Sub
    End Sub
    
    Note: rather than hardcoding the range name one could check all defined ranges for the current sheet and try to find the right one but there are a number of drawbacks:
  • a cell could be a member of several ranges (since ranges can overlap). Which range should be picked for sorting?
  • if multiple cells are selected (e.g. a row) there is an even higher chance of confusion. Some of the selected cells might be in range 1, others in range 2 etc. so which range is to be picked? And it is unlikely that all ranges need to be sorted.

    Both macros need to be entered in a macro library. I chose My Macros -> Standard -> Module1.

    Set event listener

    Now that the macro is in place I can set up the event trigger.
  • Right click on the sheet name and choose Sheet Events...
  • In the Assign Action window select Content changed and click Macro...
  • In the Macro Selector window navigate to (in my case) My Macros -> Standard -> Module1 and select SortRange in the list of macros and click OK
  • Back again in the Assign Action window click OK too

    Now you have it: any change in the range i.e. columns A or B will trigger a re-sort. Any other change on the sheet won't.
    If you create the range in a different place the sort will still be triggered.


    Below I'll show a couple of scenarios and how the macros behave. Assume there is a defined range 'MyData' somewhere on the spreadsheet, say C5:D10. The column headers have been entered in B5 and C5.

    Then the sheet event trigger needs to be assigned as described above and I can start entering the data.

    I begin with B6=A and C6=20. Nothing happens other than the named range being marked due to the macro.

    Then I enter B7=B and C7=34 and now the sort trigger already fires and sorts my columns and reverses the order.

    I enter another data set B8=C and C8=51
    And finally the last data B9=D and C9=40 which is moved up two rows.

    Always starting with the last setup I show various scenarios to delete cells and how the sort automatically kicks in.

    Mark a single cell and delete it
    Mark a row and delete it
    Mark some disjunct cells and delete them
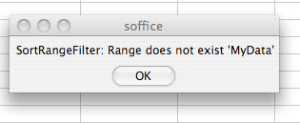
    If you accidentally delete the range 'MyData' you get an error message

    Since my macro selects the data range it stays this way after the sort has finished. Of course this could be changed but I view it as an indicator that something happened, the viewer is visually attracted to the marked data range.

  • Wednesday, July 31, 2013

    How to create a Pareto chart in OpenOffice.org or LibreOffice

    Using the data from my article about creating Pareto charts with Google charts I'd like to show here how to create Pareto charts in OpenOffice.org or LibreOffice.

    Starting with a data set the same issues need to be resolved:

  • Sorting the data
  • Calculating the accumulated percentages
  • Creating the chart with data in columns, percentages as a line and two y-axes.

    First lets enter the data in a spreadsheet like this:

    I added already the third column labeled Pctg which will be calculated later.

    Step 1: sort the data

    Mark all rows from 2 to the last and call Data -> Sort... and in the Sort Criteria tab choose Sort key 1 and change the entry to Column B and also tick Descending and finally OK.

    Step 2: Create the Percentage values

    Click on C2 and enter this formula = 100*SUM(B$2:B2)/SUM(B$2:B$8) . Note that there is only one variable B2, the other rows are fixed.

    and copy it to C3:C8 by dragging it down. This should result in the accumulated percentages being calculated

    Now we have all the data so we can continue with the actual chart.

    Step 3: Create the basic chart

    Go to Insert -> Chart... and in the upcoming Chart Wizard choose the chart type Column and Line with Number of lines set to 1 (if not already done so) and click Next.

    Select the correct data range $A$1:$c$8 by either using your mouse in the data range selector or by entering it manually. Leave the settings Data series in columns, First row as label, First column as label and click Next.

    The following Data Series window should have everything filled in correctly, click Next.

    In the last window enter titles and remove the legend:

  • Title: Pareto chart
  • X axis: Category
  • Y axis: Sizeand click
  • Untick Display legend
    and click Finish.

    And this is the result:

    What you can see: there is only one y-axis and the data and percentage units are not distinguishable.

    Step 4: Fine tune the chart

    First we are introducing an additonal y-axis. Ensure the chart is marked.
  • Right click on the chart and choose Insert/Delete Axes.... Under Secondary Axes tick Y axis and OK. This will create a second identical y-axis on the right.
  • With the chart still marked right click again and choose Insert Titles... and under Secondary Axes and Y axis enter Pctg.

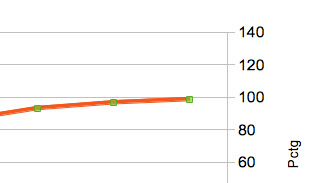
    Now we need to join the secondary y-axis with the line chart. Select the red line. This can be a bit tricky, you are successful if the green selection points are shown like this

    Now right click on the red line and choose Format Data Series.... Select the Options tab and under Align data series to tick Secondary Y axis. Click OK:

    The range of the secondary y-axis has changed to 0 - 120 but this automated setting is not yet what we want.

    Mark the secondary y-axis e.g. by clicking on any of its numbers. Choose Format Axis... and in the Scale tab go to Maximum, untick Automatic and enter 100 as the maximum value.

    This is the new graph:

    There are some more actions needed to make the graph look closer to my Google chart example but I won't show all the details:

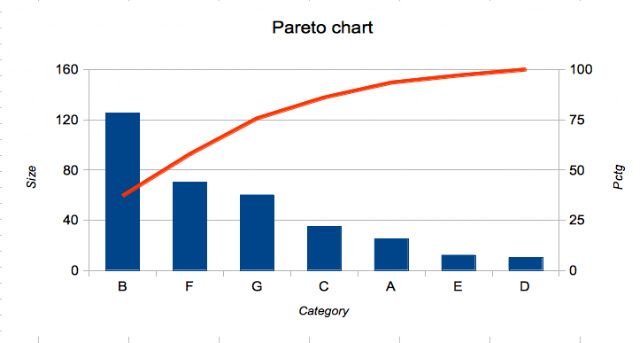
  • change the range of the primary y-axis to 160 and its major intervals to 40 and thus reduce the grid lines
  • change the major intervals of the secondary y-axis to 25
  • change the font attributes of each title to italic
    So here is the final result:
  • Tuesday, July 30, 2013

    LibreOffice writer: customize border of every second table row

    Lately I wanted to achieve the following in LibreOffice writer: I had created a table and I wanted to have borders around the uneven rows whereas rows two, four should be without borders.
    An example explains it quickly.

    Note that there is no border between cells and that the even rows don't show borders.

    Here is how to do this.

    Create table

    The first step of course is to create a table in writer via Insert -> Table and choosing 5 rows. Then fill in the cell contents as displayed above, the result being

    Remove all borders

    The next step is to clear all borders. There are two ways to do this, I'll show one.
    Click any table cell and choose Table -> Table Properties.... Click on the Set No Borders icon (circled red) and OK.

    This will result in this table.

    Adding row borders

    For this and the following steps you should enable the table toolbar via View -> Toolbars -> Table which will display a new toolbar at the bottom of your LibreOffice window.

    It is easy to set the border for one row:

  • Select the row (either by marking all cells from left to right or by moving the cursor outside of the table to the left of the row until the cursor changes shape into a little arrow and clicking that arrow)
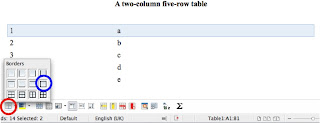
  • Click on the border icon (red circle) in the table toolbar to get a selection of border settings and set the full border (blue circle)

    which should result in this

    The cumbersome thing is: one needs to do this for each row individually, in my case rows 3 and 5.
    As one can see this is not feasible for big tables (say 20 rows or more) and there is also no easy way to change this later (if you suddenly wanted a different border setting with no borders on the left you would need to redo these steps for all rows again).
    I haven't found a nicer way to do this. Trying to mark non-consecutive rows 1, 3 and 5 did not work, in essence there doesn't seem to be a way at all in LibreOffice (or OpenOffice.org) to mark non-consecutive rows in writer (I'd be glad if someone showed me a more efficient way to set the borders).

    Anyway: with this approach I finally got my table as outlined at the beginning.

    Some more customizations: line style and colour

    Further customizations are again quite easy. First of all you always have to select the whole table (either by marking all cells or by clicking in the left cell in the first row and then shift clicking the left cell in the last row).

    Then one could set the line style by clicking the line style icon (red circle) and then choosing from the list (the blue ellipse chooses the very last entry).

    After that the table is still marked and one could continue to set the line colour by clicking the colour icon (red circle) and choosing a colour (blue circle).

    The result looks like this: a thicker border line in orange

  • Monday, July 15, 2013

    CSS customization of blogger template

    I have been asked how I achieved the coloured fonts in my code examples. It's done via some customized CSS code.

    My code examples are either inline using the <CODE> tag or longer code text is wrapped in <PRE> tags.

    Examples:

    Some inline code and

    some
    longer
    text
    

    How to add CSS customization

    In the blogger main menu choose
    Template
      Customize
        Advanced
    
    In the list of advanced customizations scroll down to
          Add CSS
    
    and in the text field enter
    code {color:#8b0080; background:#ffffff; }
    pre  {color:#8b0080; background:#ffffff; border:solid 1px black; }
    
    which shows customizations for CODE and PRE:
  • one setting for the font colour (a kind of purple)
  • one setting for the background colour (white)
    Additionally PRE gets assigned a small black border line.

    I also have another customization for H2 headers:

    h2 { text-transform: capitalize}
    
    which capitalizes text so
      This is a nice text
    is shown as

    This is a nice text

    This example shows nicely that these customizations are added on top i.e. font type, font attributes (bold in this case) etc. remain as defined earlier (in the template definition by the template author).
  • Tuesday, June 18, 2013

    Thunderbird: How to put your signature at the top of the reply

    Since I'm using Thunderbird as my email client (I have to manage several email accounts, business and private, and Thunderbird is the best tool in my view to achieve that) I want to customize it to best achieve my needs of course.

    An email reply with quoted emails arranges the answer like this.

    my handwritten reply...
    the quoted emailOn .... xyz wrote:

    Dear Andreas,
    ...
    my signature fileBest regards
    Andreas

    What I actually wanted was a different order: the signature should be on top of the original email like this.

    my handwritten reply...
    my signature fileBest regards
    Andreas
    the quoted emailOn .... xyz wrote:

    Dear Andreas,
    ...

    In order to achieve that I had to adapt two settings.

  • First of all there is a general setting maintained in Thunderbird's config file. One can change that in various ways (depending on OS) and on my Mac I'll get to it via Thunderbird -> Preferences -> Advanced and the button Config Editor ... which opens the config file. There is a setting mail.identity.default.sig_bottom which is true by default and double clicking will turn it to false.
    This is a setting for all accounts but unfortunately it does not yet achieve the desired result. The signature still sits at the bottom of the quoted email. The change basically was just an enabler to shift the signature file.
  • Now comes the fine tuning of the accounts. You can decide for each account where to put the signature file and this is done by ticking a few boxes and making the right selections.
    Pick the email account and go to View settings for this account and choose Composition & Addressing. Aside from ticking the appropriate boxes the most important change was to choose where to put the signature 'below my reply (above the quote).

    Of course I did not invent this answer but rather than having to search for it in Mozilla forums again and again (in case I forget) I put it down here as much for my own good as for the reader's who quickly stumbles upon it in a web search.

  • Tuesday, April 30, 2013

    Solaris: using pmap to identify shared and private memory of a process

    The Solaris operating system contains a number of nice commands to explore the status of processes.
    They all access the process details maintained in the process directory /proc.

    In this article I'll take a look into the pmap command (the link pointing to the current Solaris documentation at Oracle who inherited Solaris after acquiring Sun Microsystems) which allows to investigate the process memory layout in various ways (refer to the link for examples). A user can investigate his own processes, the root user can investigate any process.

    pmap output for one process

    In the first part of the discussion I will look into the pmap details of one process. As one can see from the output below pmap can answer those questions:
  • How much shared and private memory is a process using?
  • Which components are using how much memory? One could identify libraries or the stack or whatever to be a memory eater.

    I am using the  pmap -x pid  command to get a listing of all components and their address mapping.

    Here is the  pmap -x  example for a simple 'sleep 50' command.

    647:    /bin/sleep 50
     Address  Kbytes     RSS    Anon  Locked Mode   Mapped File
    08046000       8       8       4       - rw---    [ stack ]
    08050000       4       4       -       - r-x--  sleep
    08061000       4       4       -       - rw---  sleep
    08062000       8       8       -       - rw---    [ heap ]
    D1C90000      56      24       -       - r-x--  methods_unicode.so.3
    D1CAD000       4       4       4       - rwx--  methods_unicode.so.3
    D1CB0000    1772      36       -       - r-x--  de_DE.UTF-8.so.3
    D1E7A000       4       4       4       - rwx--  de_DE.UTF-8.so.3
    D1E80000    1080     664       -       - r-x--  libc.so.1
    D1F90000      24      12      12       - rwx--    [ anon ]
    D1F9E000      32      32      28       - rwx--  libc.so.1
    D1FA6000       8       8       8       - rwx--  libc.so.1
    D1FC0000       4       4       4       - rwx--    [ anon ]
    D1FC4000     160     160       -       - r-x--  ld.so.1
    D1FF0000       4       4       4       - rwx--    [ anon ]
    D1FF4000       4       4       -       - rwxs-    [ anon ]
    D1FFC000       8       8       8       - rwx--  ld.so.1
    D1FFE000       4       4       4       - rwx--  ld.so.1
    -------- ------- ------- ------- -------
    total Kb    3188     992      80       -


    Some Notes:

  • 647 in the first line is the process id.
  • The RSS column reports the physical memory i.e. shared and private combined.
  • The Anon column reports the private memory, thus shared can be calculated as RSS - Anon.
  • The mode column determines how to handle the various lines. The read bit is set always since it does not make sense to put something into memory which cannot be read. Looking at the write and execute bits there are these options.
    • r--: data, read-only
    • rw-: data
    • rwx: data, executable
    • r-x: this is code, it cannot be overwritten
    Things get a little more complex when considering that certain components appear more than once. If we look at libc.so.1 we see three occurances, one of them in mode r-x (code) and the other two in mode rwx (writable data). You'll also note four entries for [ anon ] when pmap cannot find a common name for the entry in this address space.

    What I want to do now is simplify and condense the pmap output by

  • reducing the number of columns: Address, Kbytes and Locked will be skipped
  • replacing RSS by a column Shared
  • replacing Mode by a column Type which holds only two possible values: code or data
  • merging all data lines for a mapped file into one (eventually all r--, rw- and rwx lines will be merged into one. This is not the case in this simple example but could well happen in more complex cases.)

    The table below shows calculations for libc.so.1 and [ anon ] rows: how to get from RSS and Anon to shared and private and how to merge multiple data lines into one. There should be only one code line anyway so nothing needs to be done here (other than maybe introduce a check to find out if this is really the case).

    RSS AnonShared Private Shared
    Merged
    Private
    Merged
    New name
    libc.so.1 r-x664066406640libc.so.1 code
    libc.so.1 rwx32284284
    = 4 + 0
    36
    = 28 + 8
    libc.so.1 data
    8808
    [ anon ] rwx 12120124
    =0 + 0 + 0 + 4
    20
    = 12 + 4 + 4 + 0
    [ anon ] data
    4404
    4404
    4040

    Here is how I want the 'pmap -x' output to look like:

    678:  /bin/sleep 50
          Shared      Private Type Mapped File
    ------------ ------------ ---- ----------
               4           20 data [ anon ]
               8            0 data [ heap ]
               4            4 data [ stack ]
               0            4 data de_DE.UTF-8.so.3
              36            0 code de_DE.UTF-8.so.3
               0           12 data ld.so.1
             160            0 code ld.so.1
               4           36 data libc.so.1
             664            0 code libc.so.1
               0            4 data methods_unicode.so.3
              24            0 code methods_unicode.so.3
               4            0 code sleep
               4            0 data sleep
    ------------ ------------ ---- ----------
             912           80      Total
    
    Looking at the total line you'll see that adding shared and private 912 + 80 = 992 which is the RSS total in the original pmap output.

    Here is a little nawk script to show how it can be done.

    NR==1     { header = $0; # first line }
    $1~/----/ { exit;        # no more processing after this line }
    NR>2      {
      # Capture 4 columns of interest
      rss = $3;     if(rss=="-")     rss = 0;
      private = $4; if(private=="-") private = 0;
      mode = substr($6,1,3);
      file = $7 " " $8 " " $9 " " $10;
    
      # Some calculations
      shared = rss - private;
      type   = "data"; if(mode=="r-x") type = "code";
    
      # Accumulate totals for each (file,type) combination
      sharedTotal[file,type] +=shared;
      privateTotal[file,type] +=private;
    }
    
    END {
      if( header=="" ) exit;
      print header;
      printf "%12s %12s %4.4s %s\n", "Shared", "Private", "Type", "Mapped File";
      printf "%12s %12s %4.4s %s\n", "------------", "------------", "----", "----------";
    
      shared = 0; private = 0;
      command = "sort +3";
      for( ij in sharedTotal ) {
        split(ij, a, SUBSEP);
        printf "%12d %12d %4.4s %s\n", sharedTotal[ij], privateTotal[ij], a[2], a[1] | command ;
        shared += sharedTotal[ij];
        private += privateTotal[ij];
      }
      close(command);
    
      printf "%12s %12s %4.4s %s\n", "------------", "------------", "----", "----------";
      printf "%12d %12d %4.4s %s\n", shared, private, "", "Total";
    
    }
    

    Note the interesting use of the pipe in printf "..." | command in the 'for' loop which will sort the printed lines by mapped filename, a construct which does not exist in the old awk. Also it is necessary to close the file descriptor before printing the footer lines, otherwise they would appear first and the sorted lines would be printed at the very end while finishing the program.

    Of course bigger programs lead to bigger pmap output naturally e.g. firefox created more than 600 lines.

    Comparing pmap for two (or more) processes

    Now what you really want to do is apply this memory check to all of your processes and do a comparison of the totals.

    When you compare the entries for two different process some of the mapped files will appear in both lists ( libc.so.1 will probably be on each process map). Looking at the shared and private memory there is a significant distinction. The private memory is really private and belongs to just one process whereas the shared memory is shared between processes. The consequences for counting memory are: private memory can simply be counted per process and the total is the sum of all whereas shared memory of two processes is

  • the memory in common
  • the shared memory used by just the first process
  • the shared memory used by just the second process
    In order to determine that one has to go through the list of mapped files and check for each of them whether they are unique to the process or shared with the second one.

    This idea can be applied to more processes too of course.

    This little shell script runs the awk script from above for every pid belonging to USER and stores its output in a file. Another awk script prints the 'Total' line of these files and sums up the values for shared and private and print an overall total.

    #!/bin/sh
    
    PSLIST=`/bin/ps -u $USER -o pid | sed 1d`
    [ -z "$PSLIST" ] && exit 1
    
    # Run 'pmap -x' for each process and condense its output with the script above
    for pid in $PSLIST  ; do
      pmap -x $pid | nawk -f pmapx.awk > pmapx.$pid
    done
    
    # Sort the filenames numerically
    FILENAMES=`/bin/ls pmapx.* | sort -t. +1n`
    
    nawk '
    BEGIN { newFile = 1 }
    newFile==1 { 
      cmd = $0; 
      newFile = 0;
      next;
    }
    /^-----/ {
      # The dashed lines serve as separators
      pmap = ++pmap %2;  # pmap alternates between 1 and 0
      next
    }
    pmap==1 {
      # There is some pmap output to be parsed
      file = $4 " " $5 " " $6 " " $7;
      type = $3;
      # Find the biggest shared
      if( $1 > shared[type,file] ) shared[type,file] = $1;
    }
    /Total/ {
      # Use the 'Total' line to get the already accumulated private memory
      private += $2;
      printf "%12d %12d   %s\n", $1, $2, cmd;
      # Now expect a new file
      newFile = 1;
    }
    END {
      for( ij in shared )
        sharedTotal += shared[ij];
      printf "%12s %12s   %s\n", "------------", "------------", "---------------";
      printf "%12d %12d   %s\n", sharedTotal, private, "Total"
    }
    ' $FILENAMES
    

    This will lead to this output (shortened a little).
    First of all it lists pmap errors as they occur for processes which cannot be examined.
    Then the totals of the condensed 'pmap -x' files are shown together with process id and name.
    At the end there is a total line but - as explained above - the total shared is not equal to the sum of the shared memory entries in the list whereas the private total is equal to the sum of the private memory in the list.

    pmap: cannot examine 627: permission denied
    ...
            1048           24   828:        /bin/ksh /usr/dt/bin/Xsession
            2180           84   863:        /usr/bin/iiimx -iiimd
            2740          556   864:        iiimd -nodaemon -desktop -udsfile /tmp/.iiim-andreash/:0.0 -vardir /ex
            3588         2552   867:        /usr/lib/gconfd-2 8
    ...
            2312           44   920:        /usr/dt/bin/sdt_shell -c unsetenv _ PWD;            unsetenv DT;
            1284           24   922:        -csh -c unsetenv _ PWD;             unsetenv DT;      setenv DISPLAY :
            1032           20   934:        /bin/ksh /usr/dt/config/Xsession2.jds
           15324          404   936:        /usr/bin/gnome-session
            1752           36   943:        /usr/bin/gnome-keyring-daemon
            3376          232   948:        /usr/lib/bonobo-activation-server --ac-activate --ior-output-fd=23
            5072          276   950:        gnome-smproxy --sm-client-id default0
           10120          436   952:        /usr/lib/gnome-settings-daemon --oaf-activate-iid=OAFIID:GNOME_Setting
            9556         2960   964:        /usr/bin/metacity --sm-client-id=default1
           15176        23648   1050:       /usr/bin/gnome-terminal
     ...
            1560           32   10640:      /bin/bash /usr/bin/firefox
            1588           28   10652:      /bin/bash /usr/lib/firefox/run-mozilla.sh /usr/lib/firefox/firefox-bin
           40628        98560   10656:      /usr/lib/firefox/firefox-bin
            1060           60   22265:      sh
            1248           48   28233:      csh
            1524           48   29139:      vi
    ------------ ------------   ---------------
           72260       148444   Total
    

    The root user could run this script for all users in order to get an overview of all users.

  • Monday, April 8, 2013

    String extracts in Perl with split, match and regular expressions

    Lately I had to solve the following issue:
    extract process id (pid) and program name from the header line of pmap.

    The strings can take these forms from simple to complex:

    123:     cmd
    123:     cmd -x foo
    123:     /usr/bin/cmd
    123:     /usr/bin/cmd -x foo
    
    and more complex with more parameters which are trickier to parse
    123:     /usr/bin/cmd -x /home/foo
    123:     /usr/bin/cmd -x 456: -d /home/foo
    
    i.e. very genereally speaking there is a pid followed by a colon and then a more or less complex command line where the program name can be fully qualified and carry a number of parameters. The last example deliberately introduces the digit and colon again as parameters.

    Here is a try to express the string more verbally as a sequence of

  • a number of digits
  • a colon
  • a tab
  • a program name, optionally qualified
  • optionally: an arbitrary number of space separated parameters (could me multiple spaces)

    There a various solutions to this in Perl and here I'll show two.

    # Example string
    $str = "123:     /usr/bin/cmd -x /home/foo";
    #           ^ should be a tab here
    
    # First I split the string using an optional colon :* 
    # and a sequence of white space \s+ as field delimiters.
    # This will give me the pid and the program name and strip of the parameters
    ($pid,$cmd) = split /:*\s+/,$str;
    
    # In case of a fully qualified program nane 
    # everything up to the last slash needs to be removed
    $cmd =~ s/.*\///;
    
    print "pid = $pid  X  cmd = $cmd\n";
    

    Always looking for more concise code I wondered whether these two lines couldn't be shortened. Here is a one liner which requires explanation of course.

    # Example string
    $str = "123:    /usr/bin/cmd -x /home/foo";
    #           ^ should be a tab here
    
    # I try to match the following reqular expression
    #   a sequence of digits    (\d+)    which will become $1 if successful
    #   a colon and a tab
    #   an optional sequence of characters ending in slash   (\S+\/)*   
    #                which will become $2
    #   a sequence of characters   (\S+)    which will become $3
    # The remainder of the string is not important as 
    # we anchor the regular expression at the beginning.
    $str =~ /^(\d+):\t(\S+\/)*(\S+)/ ;
    
    print "pid = $1  X  cmd = $3\n";
    

    For easier readability I would have preferred the first code but when taking a deeper look I found some flaws in it namely the handling of incorrect strings. Assume this string below where the colon is missing and a string sits between pid and program name

    $str = "123 xyz        /usr/bin/cmd -x 456:  /home/foo";
    
    The codes will result in
    # Code 1
    pid = 123 xyz /usr/bin/cmd -x 456  X  cmd = foo
    
    # Code 2
    pid = /home/  X  cmd =
    
    In both cases the split happens at the wrong place with unforeseeable results.
    I can use the second code though to its advantage by applying a check.
    if( $str =~ /^(\d+):\t(\S+\/)*(\S+)/ ) {
      print "pid = $1  X  cmd = $3\n";
    }
    
    i.e. only when the regular expression is really matched I will use its values. The check gives me assurance.
    I can't do this with the split in the first code other than doing a post-check by checking whether the pid really consists of digits etc. which would increase the code.

    So I decided to use the regular expression in my code since it is still fairly readable by extracting just three parts of the overall string.
    Would I want to extract more, say five or eight components, I probably would fall back to the split and a subsequent validity check.

  • Thursday, April 4, 2013

    A general approach to command line switches and their default values in Perl

    In the UNIX world you'll rarely find a program which doesn't support a few or many arguments (or command line parameters) which influence the execution of the program.

    When Perl programs require arguments (one of the simplest cases: an input filename) one could investigate the ARGV hash (an approach which works well in easy cases) or one could turn to one of the Perl modules, in particular if the arguments are command line switches.

    In this article I will discuss a few types of command line switches and the possible logic behind.

    What is a command line switch?

    Just to recap: a command line switch is traditionally denoted as a hyphen followed by a letter optionally followed by a value e.g.  -d or  -d 25 . Note the space between the switch and its value. Some programs require this space whereas other require the value to be attached to the switch like -d25 and still others allow both. Some programs allow switches to be concatenated like  -ltr instead of  -l -t -r . Others allow switches to be more than one letter. Some programs allow a switch to appear multiple times like -v in awk.
    Further complexities exist: one switch might override others. Some switches exclude each other mutually.
    All these cases would need to be handled properly.

    On top of that (I think it was) the GNU world introduced double hyphen switches with (usually) string switches e.g.  --verbose .

    In the remainder of this article I will only use the simple case of single letter switches with or without argument. I will be using Getopt::Std, one of the core Perl modules and its function getopts. Its basic usage is  getopts('ab:',\%opts); for two switches  -a and  -b foo.

    Various types of command line switches with or without default values

    The typical distinction between command line switches is whether they are boolean (switched on or off) or carry an additional argument. Then there is the question: if a command line switch is absent should there be a default value used in the program?

    The following table explains the differences and shows a few examples.

    switchExampleDefaultNotes
     -a 
    ...falseA boolean switch by its very nature has a default value true or false which should be the opposite of what the switch intends to trigger.
     -d $HOME/tmp 
    output directory/tmpCertain things in the program require a default value e.g. the program needs to know where to store its output files. It's left to the programmer to decide which of the default values can be overruled by command line switches.
     -u joe,sandy 
    user listcurrent userSome command line switches can take more complex arguments, in this case a comma separated list of users. Its absence should be covered by a reasonable default value e.g. the current user.
     -p 1507 
    process idall processesSome switches do specify a setting which acts as a filter or a kind of a restriction but its absence does not imply a default value but is somewhat vague.
    In the 'user list' example before another default behaviour could have been 'all users' instead of 'current user'.

    Rather than defining a list of variables to set the defaults like

    $OUTDIR = "/tmp";
    $USERS = $ENV{'USER'};
    ...
    
    and later somehow associate these variables with the switches a (in my view) cleaner approach is to
  • define the defaults in a hash (the keys are the switches)
  • create a new hash (again with switches for keys) and set them to either the defaults or values supplied by the command line
    The following Perl program handles the cases above.
  • boolean switches and unspecified defaults are set to undef, all others are set to their reasonable default values.
  • the  ... ? ... : ... operator is used to set the actual variables
    (Getopt::Std sets boolean switches to 1 which represents true, the opposite (and default) could be anything that evaluates to false in an if(...) clause, I chose 'undef' rather than 0).

    #!/usr/bin/perl
    use strict;
    
    use Getopt::Std;        # to process command line arguments
    
    # Define the defaults in a hash
    my %defaults;
    $defaults{"a"}  = undef;
    $defaults{"d"}  = "/tmp";
    $defaults{"u"}  = $ENV{'USER'};
    $defaults{"p"}  = undef;
    
    # Retrieve the command line switches into a hash
    # making sure which ones are boolean and which require an argument with ':'
    my %opts;
    getopts('ad:u:p:',\%opts);
    
    # Put either the default values or the command line switch arguments into a hash
    my %vars;
    foreach my $key (keys %defaults) {
      $vars{$key}    = exists $opts{$key} ? $opts{$key} : $defaults{$key} ;
    }
    
    # Test output: see what is contained in 'vars'
    foreach my $key (keys %vars) {
      print $key," ",$vars{$key},"\n";
    }
    print "\n";
    
    # Check decision tree for boolean and unspecified switches
    print "a is set\n" if( $vars{"a"} );
    print "p: all processes\n" unless( $vars{"p"} );
    

    If run without any command line switches:

    u andreas
    p 
    a 
    d /tmp
    
    p: all processes
    

    With -a and -u

    ... -a -u joe,sandy
    
    u joe,sandy
    p 
    a 1
    d /tmp
    
    a is set
    p: all processes
    

    With -p and -d

    ... -d $HOME/tmp -p 1507
    
    u andreas
    p 1507
    a 
    d /export/home/andreas/tmp
    

    With this general approach one hash 'vars' contains all the information and its contents can be used directly later in the program (like -d output directory) or used in a decision process defined vs. undefined.

    Of course there are more issues like the ones mentioned above (e.g. conflicting switches) or validity of values (e.g. does the output directory exist and is writable) but they need to be resolved somewhere else in the code.

  • Saturday, March 23, 2013

    Analyzing wtmpx on Sun Ray servers (part 2)

    Following the previous blog entry in this article I'll take a deeper look into wtmpx of a Sun Ray server over time.

    At my former company there were hundreds of Sun Ray servers deployed all over the world. In this example I picked one to show a couple of ways what to do with wtmpx data of Sun Ray servers.
    Looking at wtmpx data one could get a first impression on how well Sun Ray servers are being used. Of course the sheer existence of a user session does not say much about what is being done in a session, which applications are being run by the user, is the user typing at all or is only the screenlock running but it is a first picture of what is going on on a machine.

    All of the graphs below have been created out of one wtmpx file on one particular server in Europe (I have disguised the name).

    In the graphs below I'll show certain takes on the data:

  • all sesssions and their durations (displayed as vectors. I chose two colours simply for illustration purposes, red and blue don't have any other meaning).
  • the count of running sessions on a particular day
  • Histograms to show the number of sessions which lasted a particular time. I chose time ranges 1-10, 11-20 etc. and an additional '1' which contains all sessions lasting less than one day.

    I am showing in three tables the graphs

  • for one full year April 2006 - March 2007
  • for one month in that year (December 2006)
  • for one week in that year (first week of December 2006)

    Year view
    April 2006 - March 2007
    All displays
    Each Sun Ray session is assigned a DISPLAY number. Looking at the distribution of DISPLAY numbers the graphs shows a not quite even distribution. From time to time there are gaps. Few high numbered DISPLAYs have been chosen and the assignment is not continuous. Particularly interesting to me are the few above 120. How did they get into place at all?
    This would require some digging into the Sun Ray server details, something I haven't done.
    Displays
    0-100 only

    Same as before but restricted to DISPLAY numbers up to 100.
    Count
    In the latter half of 2006 more Sun Ray servers were deployed in this location which explains the count decrease after August.
    Each week shows a fuzzy peak which is due to additional sessions started and stopped during that week.
    Histogram
    Very clearly the majority of sessions did last less than one day.
    But there were also some very long lasting sessions (several months, look at the 101-110 bin in the next histogram) and in fact there is no technical reason to login/logout the same day: it was company policy to advise people to logout at the end of their working day, one of the reasons being not to leave behind unsaved data in open windows in case one of the rare event of a server crash. Another reason was that some applications did show memory leaks over time (e.g. web browsers) and in order to prevent that one would have needed to restart these applications regularly. The easier advice was to restart the session and thus restart the applications automatically.
    A good portion of the employees did not follow the daily logout advice as can be seen in the next graph.
    Histogram
    more than 10 days

    This shows the sessions which took longer than 10 days (the previous graph without the first two columns).

    As one can see the Sun Ray servers first of all could run for years without having to reboot and could sustain user sessions equally long. The longest user session I could find (not on this machine) was about 400 days i.e. well over a year. In my experience there were more reboots caused by power issues in the building or server room reorganizations than by actual machine or software failures (something which I couldn't say for my Windows machines nor my Macs).

    Month view
    December 2006
    Displays
    0-100 only

    In the month view the sessions (display numbers and duration) are better viewable and distinguishable than in the year view. One can clearly see numerous short lived sessions, weekly sessions but also longer sessions going beyond the end of the month.
    Count
    In this view the weekly pattern becomes more obvious. Above a certain level of seemingly permanent sessions each working week day shows some peaks. At the end of the month after December 23rd there is a significant drop in session activity (many people seem to have logged out for Christmas) but the last working days in December (27, 28 and 29, the 30th was a Saturday in 2006) show similar peaks as before.
    Histogram
    The histograms show the same pattern than in the year view.
    Histogram
    more than 10 days

    Week view
    December 1-8 2006
    Displays
    0-100 only
    Count
    December 2 and 3 2006 were a weekend.
    On December 4 one can see the session increase at around a third of the day column which is approximately 8:00. Later that day there is a drop (I would say at around 17:00) but not to the level of the weekend so out of all the new sessions at the start of the week some logged out again and others stayed logged on.
    At Friday December 7 in the afternoon the number of sessions reaches approximately the level of the weekend before.

    A few more interesting things: during the weekend December 2-3 there is also a slight fluctuation, why? There is a small chance that people had come to the office to do some work but a better explanation is that Sun Microsystems had established at that time a functioning "work from home" model which included provisioning employees with Sun Ray clients at home. Running a user session on a Sun Ray server in any location and accessing it from home was standard working practice, in my case server and home were hundreds of kilometers apart and even situated in different countries. So going to your home Sun Ray client and either starting a new session or switching to your existing one could be done and some people did so over the weekend when needed.
    In this example the weekend fluctuation is two or three sessions.

    Histogram
    Same patterns than in the year and month view: many single day sessions have been run and a few longer ones have been started in this week.

    All of the above relate to one machine. What one could do now is of course a broader analysis. Compare this machine to the other machines in the same location. Compare this location with other locations in the same country and in other countries.
    What are the differences? What are the similarities?
    Increase the time range and look at several years.
    If there are any changes what factors could have influenced them?
    Taking into account people data one could introduce groupings (e.g. by department, office building, ...) and look at these groups separately and again try to compare, find patterns etc.

    About the gnuplot code

    Each of the three types of graphs had a different data source.
  • display duration: the data file as explained in the previous blog
  • count and histogram: their files were generated by parsing the original data file with a little awk

    The graphs with display number limits or different periods of time were simply using new yrange or xrange settings (and of course different titles and output file names).

    The histogram graph for durations greater than 10 used the histogram data file minus the first two lines.

    Code for counts based on data files like this (timestamp and count):

    20060405130501 35 
    20060405135502 34 
    20060405150057 33 
    20060405151213 32 
    20060405152449 33 
    20060405164318 34 
    20060405170129 33 
    20060405170954 32 
    20060405172414 31 
    20060405173537 30 
    
    
    set title "wtmpx - server name\nSession count\n1 year"
    set key off
    set ylabel "Number of sessions"
    set yrange [0:99]
    set timefmt "%Y%m%d%H%M%S"
    set xlabel "Date"
    set xdata time
    set xrange ['20060401000000':'20070401000000']
    set format x "%Y\n%m/%d"
    set output "filename_count.png"
    plot '...filename...' using 1:2 with lines lc rgb "#800000"
    

    Code for histograms based on data files like this (bins and frequencies):

    1 43 
    1-10 24 
    11-20 10 
    21-30 1 
    31-40 1 
    41-50 0 
    51-60 1 
    61-70 0 
    71-80 0 
    
    set title "wtmpx - server name\nHistogram\n1 year"
    set key off
    set ylabel "Frequencey"
    set xlabel "Duration of session\n(in n days or less)"
    set style data histograms
    set style fill solid border -1
    set output "filename_histo.png"
    plot '...filename...' using 2:xtic(1) lc rgb "navy"


    All of this was done in gnuplot 4.4 on a Solaris 10 machine.

  • Friday, March 22, 2013

    Analyzing wtmpx on Sun Ray servers (part 1)

    Sun Rays are Sun Microsystems (now Oracle) thin clients and they basically consist of a Sun Ray server (which is actually not a particular type of hardware but a piece of software which can run on various platforms. In this article Sun Ray server will refer to both the machine and the software, the context should make it clear.) and the respective Sun Ray clients (which used to be a particular device which came in various flavours and later was complemented by a soft client in order to give e.g. notebook or tablet users a virtual option).

    When users are logging into the Sun Ray server the respective entries in utmpx and wtmpx need to be created and there is a distinction between logins coming from a Sun Ray client (hard or soft) or other sources (e.g. console or remote logins).

    In the next two articles I will take a deeper look into the wtmpx entries created by Sun Ray clients.

    How to identify a Sun Ray client login

    When looking at the members of 'struct futmpx' in /usr/include/utmpx.h there are two entries which identify a Sun Ray client login.
    FIrst of all ut_line is set to dtlocal and secondly the ut_host entry contains the name of the DISPLAY i.e. a colon and a number e.g. ':21'.
    An entry in wtmpx is created for each login but also for each logout action.
    Aside from user name, date and time etc. the login entry is identified by ut_type being set to 7 (USER_PROCESS) and the corresponding logout enty has ut_type set to 8.
    Here is the example of a login/logout pair of lines for user 'joes' but of course these lines are not adjacent since many more entries have been happening after the login (the example is the output as shown by fwtmp).
    joes   dt6q  dtlocal  40881  7 0000 0000 1164719643 0 0 4  :21  Tue Nov 28 14:14:03 2006
    joes   dt6q  dtlocal  40881  8 0000 0000 1167177826 0 0 4  :21  Wed Dec 27 01:03:46 2006
    
    i.e. user 'joes' logged in on Nov 28 with process id 40881 and his DISPLAY was assigned ':21'. He logged out again about one month later.

    There are a couple of cases when no corresponding logout entry can be found in wtmpx: the server crashed unexpectedly (quite rare) or the admins have set up regular backup and re-init of wtmpx files (very often retained as wtmpx.1, wtmpx.2 a.s.o.) so the login entry would be in another file than the logout entry. The code in this article will assume that corresponding login/logout pairs can be found in one file.

    My code will now scan wtmpx for all login/logout pairs of Sun Ray entries and create a data file which can be used by gnuplot to visualize the findings.
    The graph will show the timeline on the x-axis and the DISPLAY numbers on the y-axis.
    A login/logout pair will be represented by a vector which starts at login time and ends at logout time, the length of the vector being the duration of the session. The example above does look like this.

    joes  21    20061128141403 20061227010341 682.83
    
    It contains the username, the DISPLAY number, start and end time and the duration in hours. The graph would be this:

    And here is the gnuplot code:
    set title 'wtmpx - Example'
    set key off
    set grid
    
    set ylabel 'Display number'
    set ytics nomirror
    set yrange [0:30.5]
    
    set timefmt "%Y%m%d%H%M%S"
    set xlabel "Date"
    set xdata time
    set xrange ['20061101000000':'20070101000000']
    set format x "%Y\n%m/%d"
    
    set terminal png small size 600,300
    set output "Example.png"
    
    set style arrow 1 head filled size screen 0.01,20,65 ls 1 lc rgb "red"
    
    plot '...filename...' using 3:2:($5*3600):(0) with vectors arrowstyle 1
    
    Almost the same code will be used to create the graphs for many user sessions over a longer period of time.

    Create the gnuplot data file out of wtmpx

    wtmpx will require data files with entries like this:

    tmnsn    30 20060403075755 20060410153215 175.57
    tt12339  79 20060412085413 20060412180126 9.12
    nm8720    8 20060412095225 20060412180421 8.20
    rr13447  84 20060412141539 20060412183617 4.34
    oo2006  101 20060412085250 20060412201402 11.35
    zpowv    53 20060403091259 20060413010213 231.82
    

    Using the Perl module Convert::Binary::C (which I discussed in a previous article) and the knowledge about which wtmpx entries are Sun Ray entries and which can be skipped the following code creates a valid data file. After declaring the Convert::Binary::C settings (as in my previous wtmpx blog) the while loop which reads the entries follows this logic:
    it stores login entries in some data structures.
    When a corresponding logout entry is found a line of data is printed.
    When a system reboot entry is found all currently stored login entries will transformed into data using the reboot time as the time of logout for all entries.
    After having read the complete wtmpx file the remaining login entries correspond to sessions which are still active. They will be transformed into data lines too.

    use strict;
    use Convert::Binary::C;
    
    my $utmpxh = "utmpx.h";               # include file
    
    # two OS specific settings
    my $struct = "futmpx";
    my $wtmpx  = "/var/adm/wtmpx";        # on Solaris
    
    my $c = Convert::Binary::C->new(
               Include => ['/usr/include', '/usr/include/i386-linux-gnu'],
               Define => [qw(__sparc)]
            );
    $c->parse_file( $utmpxh );
    
    # Choose native alignment
    $c->configure( Alignment => 0 );      # the same on both OSs
    my $sizeof = $c->sizeof( $struct );   # on Solaris (=372)
    
    $c->tag( $struct.'.ut_user', Format => "String" );
    $c->tag( $struct.'.ut_line', Format => "String" );
    $c->tag( $struct.'.ut_host', Format => "String" );
    
    my %start;                       # hash to store session start times per display
    my %user;                        # hash to store session user names per display
    
    open(WTMPX, $wtmpx) || die("Cannot open $wtmpx\n");
    my $buffer;
    
    # Read wtmpx line by line
    while( read(WTMPX, $buffer, $sizeof) == $sizeof ) {
      my $unpacked = $c->unpack( $struct, $buffer);   # Solaris
    
      # We need these 5 members of 'struct futmpx'
      my $ut_user = $unpacked->{ut_user} ;          # user name
      my $ut_line = $unpacked->{ut_line} ;          # looking for 'dtlocal'
      my $display = $unpacked->{ut_host} ;          # display name like ':52'
      my $ut_type = $unpacked->{ut_type} ;          # type of entry 7=login, 8=logout
      my $epoch   = $unpacked->{ut_tv}->{tv_sec};   # the timestamp of the entry in UNIX time
    
      # If a system restart happens then all previous sessions should be
      # printed and variables re-initialized
      if($ut_line eq "system boot" || $ut_line eq "system down" ) {
        foreach my $disp (keys %start) {
          print_row($disp,$epoch);
          delete $start{$disp};
        }
      }
    
      # Skip any entry which is not 'dtlocal'
      next  if( $ut_line ne "dtlocal" );
    
      # Login entries
      if($ut_type==7) {
        # Set the start time and user for 'display' session
        $start{$display}    = $epoch;
        $user{$display}     = $ut_user;
      }
    
      # Logout entries
      if($ut_type==8) {
        # Check if a corresponding and valid 'login' entry exists
        if($start{$display} && $user{$display} eq $ut_user && $start{$display}<=$epoch) {
          print_row($display,$epoch);
          # After printing a line the 'display' can be reused
          delete $start{$display};
          delete $user($display};
        }
      }
    
    }
    close(WTMPX);
    
    # What is left now are all sessions which are still running
    my $epoch       = time();
    foreach my $disp (keys %start) {
      print_row($disp,$epoch,"ongoing");
      delete $start{$disp};
    }
    
    exit 0;
    
    # Convert epoch time to string
    sub epoch_to_date {
      my ($epoch)   = @_;
      my ($seconds, $minutes, $hours, $day_of_month, $month, $year, $wday, $yday, $isdst) = localtime($epoch);
      # return something like  20060428091531 = April 28 2006 09:15:31
      return sprintf("%04d%02d%02d%02d%02d%02d",
        $year+1900, $month+1,$day_of_month,
        $hours, $minutes, $seconds,
      );
    }
    
    # Print a data entry
    sub print_row {
      my ($disp,$epoch,$ongoing)    = @_;
    
      # Session duration in seconds
      my $duration = $epoch - $start{$disp};
    
      # Remove the colon in 'display'
      (my $d = $disp) =~ s/://;
    
      # Set 'end' to either the real end time of the session or to 'ongoing'
      my $end = epoch_to_date($epoch);
      $end = $ongoing    if($ongoing);
    
      # Now print the line
      printf "%-10s %4s %6s %s %s %.2f\n",
            $user{$disp}, $d, epoch_to_date($start{$disp}), $end, $duration/3600;
            ;
    }
    

    With data files now in place it's time to create some graphs in the next blog.